Mastering EXC_BAD_ACCESS Errors in Swift: A Comprehensive Guide Introduction
As Swift developers, we strive to create robust, efficient applications. However, even the most experienced programmers can find themselves face-to-face with the notorious EXC_BAD_ACCESS error. This crash, often elusive and challenging to diagnose, can turn a smooth development process into a frustrating debugging marathon. In this comprehensive guide, we'll dissect the EXC_BAD_ACCESS error, explore its causes, and equip you with advanced strategies to conquer it.
At its core, EXC_BAD_ACCESS is an exception raised when your application attempts to access memory improperly. In the world of Swift, where we constantly work with pointers to memory addresses, this error occurs when we try to access a pointer that is invalid or no longer exists.
Let's dissect a typical EXC_BAD_ACCESS crash log:
Exception Type: EXC_BAD_ACCESS (SIGSEGV)
Exception Subtype: KERN_INVALID_ADDRESS at 0x0000000000000000- EXC: Indicates that the kernel has sent an 'exception'
- BAD ACCESS: Your app is attempting to access a memory block it shouldn't
- SIGSEGV: A Unix signal indicating a segmentation fault (sometimes you might see SIGBUS instead)
- KERN_INVALID_ADDRESS: Specifies the type of bad access
- 0x0000000000000000: The memory address where the bad access occurred
- Dangling Pointers: These occur when a pointer still references memory that has been deallocated.
- Use-After-Free: Accessing an object that has been freed or deallocated.
- Buffer Overflows: Writing beyond the bounds of allocated memory.
- Race Conditions: Concurrent access to shared resources leading to memory corruption.
- Uninitialized Memory Access: Attempting to read from memory that hasn't been properly initialized.
1. Reproducing the Crash
Before you can fix an EXC_BAD_ACCESS error, you need to reliably reproduce it. This process can be challenging, especially for intermittent crashes. Here are some advanced techniques:
- Environment Matching: Use a device farm or virtual machines to replicate the exact OS version and device model where the crash occurred.
- User Session Replay: Implement analytics that can recreate user actions leading up to the crash.
- Stress Testing: Use tools like Apple's Automation instrument to repeatedly perform actions that might trigger the crash.
2. Leveraging the Address Sanitizer (ASan)
The Address Sanitizer is a powerful tool for detecting memory errors. Here's how to get the most out of it:
-
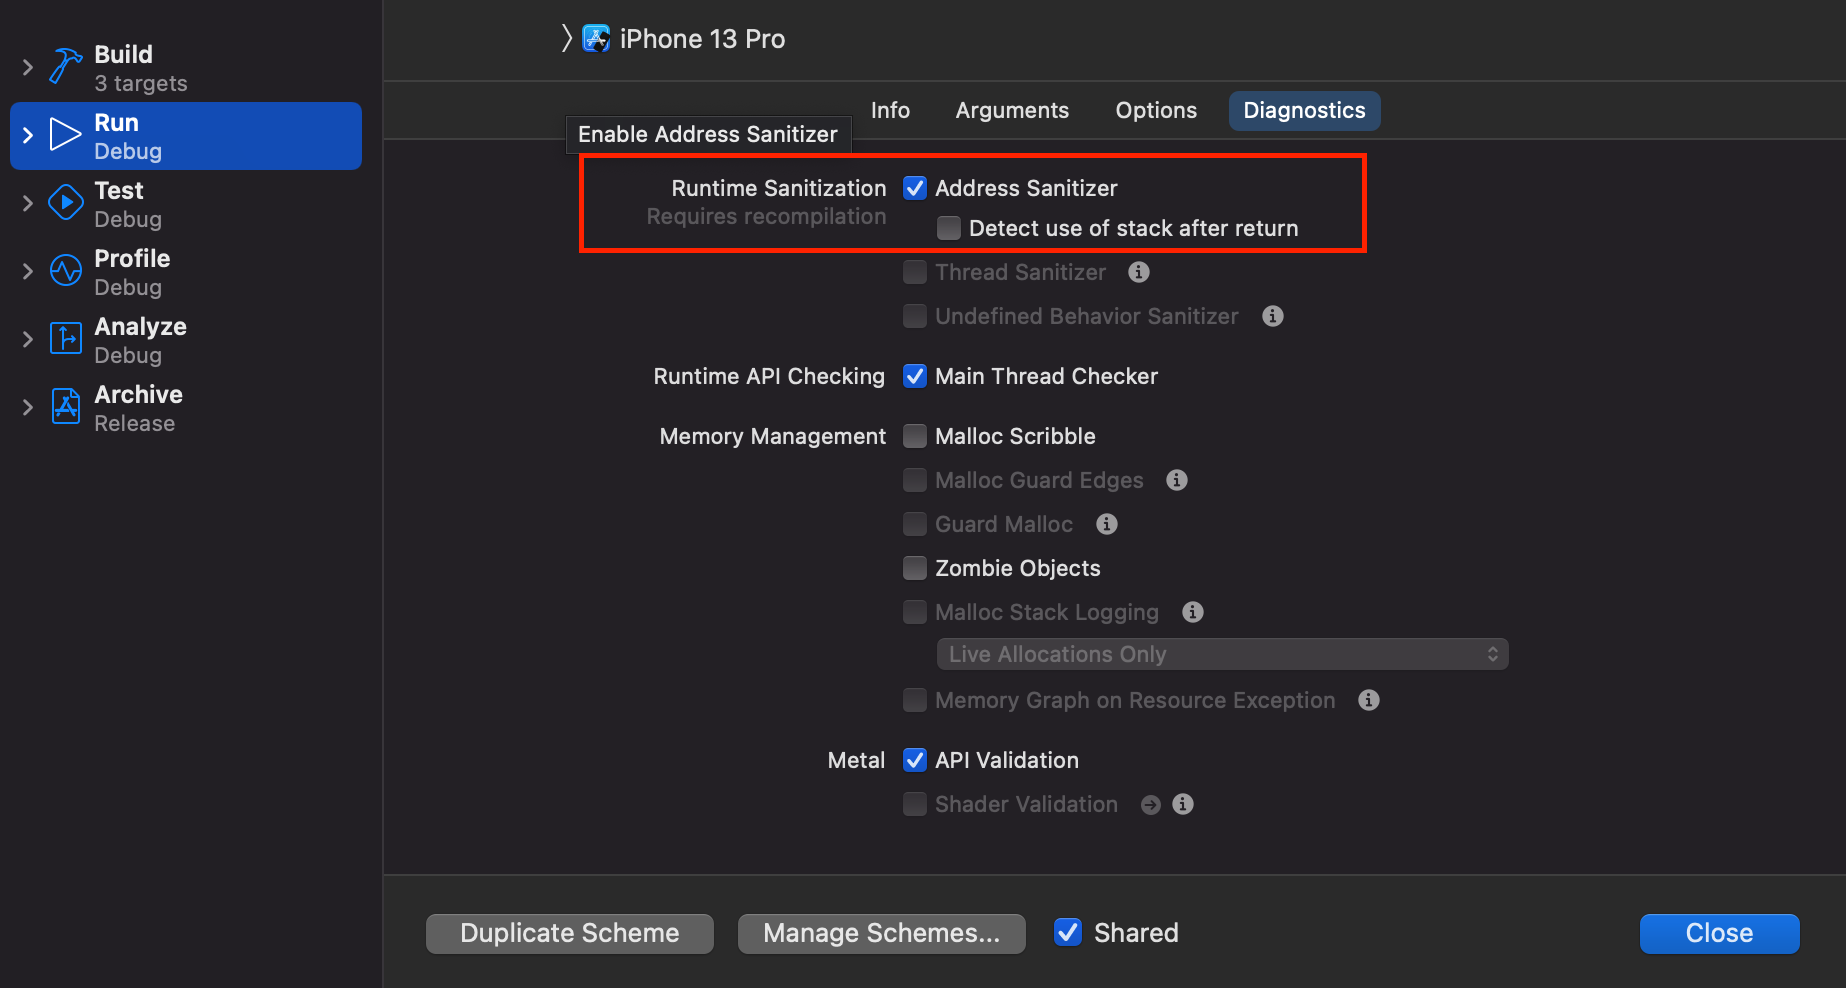
Enable ASan in your scheme settings under diagnostics.
-
Run your app in debug mode with ASan enabled.
-
ASan will pause execution and provide detailed information when it detects issues like:
- Use-after-free
- Heap buffer overflow
- Stack buffer overflow
- Global buffer overflow
- Use-after-return
You can enable the Address Sanitizer in the scheme settings of your app under diagnostics:

Pro Tip: Combine ASan with the Malloc Stack logging option for even more detailed allocation histories.
3. Thread Sanitizer for Race Conditions
Race conditions can be a sneaky cause of EXC_BAD_ACCESS errors. The Thread Sanitizer (TSan) is your ally here:
- Enable TSan in your scheme settings.
- It will detect data races and thread leaks.
- Pay attention to warnings about concurrent access to shared resources.
Note: TSan and ASan can't be used simultaneously, so you may need to run separate debugging sessions.
4. Zombie Objects: Not Just for Objective-C
While less common in Swift, Zombie Objects can still be useful, especially when interfacing with Objective-C code:
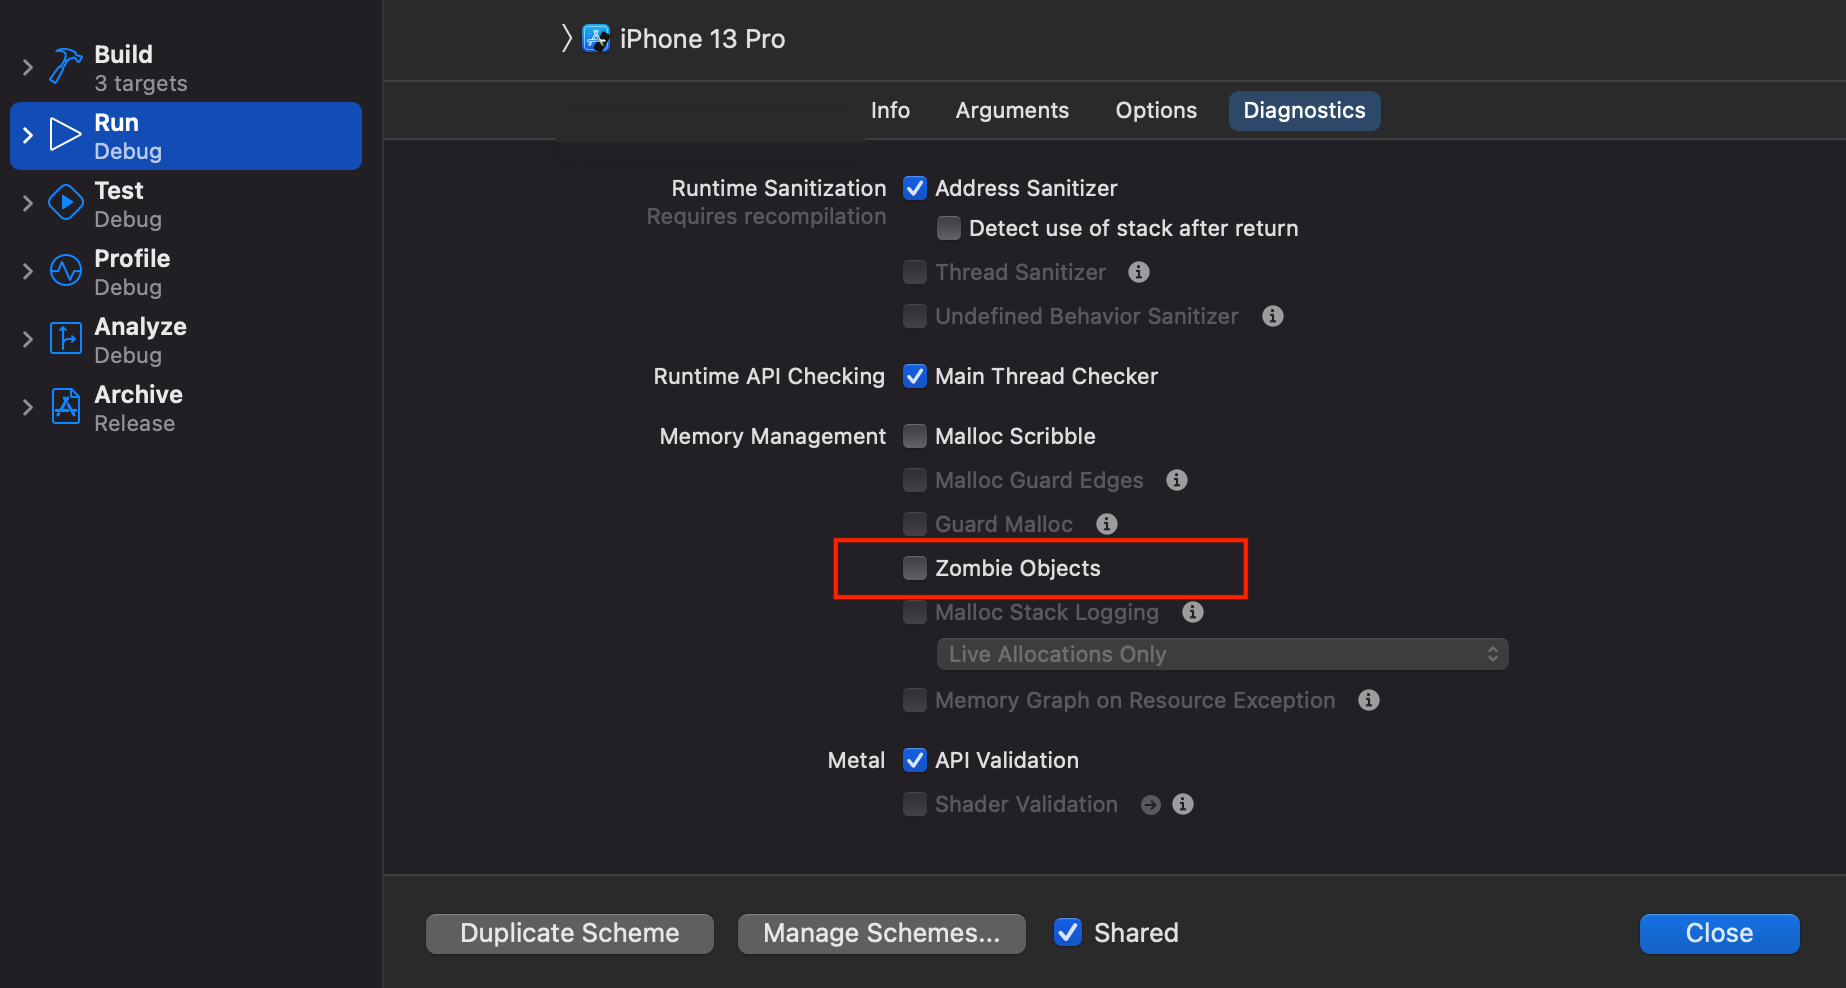
- Enable Zombie Objects in your scheme settings.
- This keeps deallocated objects alive, allowing you to identify when they're being accessed inappropriately.
- Particularly useful for tracking down use-after-free issues in mixed Swift/Objective-C codebases.
You can enable the Zombie Objects in the scheme settings of your app under diagnostics:

5. Advanced Stack Trace Analysis
Extracting maximum value from crash logs requires skill:
- Use symbolication to convert memory addresses to human-readable function names and line numbers.
- Look for patterns in the stack trace, such as recurring function calls or suspicious memory operations.
- Pay attention to system frameworks in the stack trace, as they might indicate misuse of system APIs.
6. Memory Graphs and Allocations Instrument
For deeper insight into your app's memory usage:
- Use Xcode's Memory Graph Debugger to visualize object relationships and detect retain cycles.
- The Allocations instrument in Instruments (Xcode Developer Tools) can help track down memory leaks and excessive allocations.
- Swift Memory Management Best Practices
- Prefer value types (structs) over reference types (classes) when possible.
- Use weak and unowned references judiciously to avoid retain cycles.
- Implement proper deinitializers to ensure clean-up of resources.
- Safe Concurrency
- Utilize Swift's new concurrency features (async/await, actors) to minimize manual synchronization.
- When using Grand Central Dispatch, prefer serial queues and use concurrent queues cautiously.
- Use the @Sendable attribute to ensure closure capture safety in concurrent contexts.
- Safer C Interoperability When working with C APIs or unsafe Swift:
- Use Swift's pointer types (UnsafePointer, UnsafeMutablePointer) with caution.
- Implement proper bounds checking when working with raw memory.
- Prefer Swift's safe wrappers (e.g., withUnsafeBytes) over direct pointer manipulation.
- Continuous Integration Practices
- Integrate ASan and TSan runs into your CI pipeline.
- Implement automated stress tests that can catch memory issues before they reach production.
- Code Review Focus During code reviews, pay extra attention to:
- Memory management in closures and asynchronous operations.
- Proper use of weak self to avoid retain cycles.
- Correct implementation of custom collection types.
Mastering EXC_BAD_ACCESS errors in Swift requires a multi-faceted approach. By understanding the underlying causes, leveraging advanced debugging techniques, and implementing robust prevention strategies, you can significantly reduce the occurrence of these errors in your codebase. Remember, the journey to crash-free code is ongoing. Stay curious, keep learning about Swift's memory model, and don't hesitate to dive deep into debugging tools. With persistence and the right techniques, you can turn the challenge of EXC_BAD_ACCESS errors into an opportunity to create more stable, efficient Swift applications.